
What is an inverting yield curve and does it mean we're heading for a recession?
- Written by: Luciano Rispoli, Teaching Fellow in Economics, University of Surrey
One key predictor of downturns in the economy is what is known as the yield curve. This typically refers to the market for what the US government borrows, by issuing bonds and other securities that mature over different time horizons ranging from weeks to 30 years.
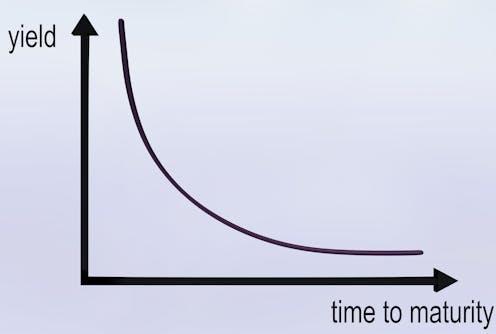
Each of these securities has its own yield (or interest rate), which moves up and down in inverse proportion to the security’s market value – so when bonds are trading at high prices, their yields will be low and vice versa. You can draw a chart that plots the yields of securities at each maturity date to see how they relate to one another, and this is known as the yield curve.
In normal times, as a compensation for higher risk, investors expect expect higher rates of interest for money they lend over a longer time horizon. To reflect this, the yield curve normally slopes up. When it instead slopes down – in other words, when it inverts – it is a sign that investors are more pessimistic about the long term than short term: they think a downturn or a recession is coming soon.
This is because they expect the Federal Reserve, the US central bank, is going to cut short-term interest rates in future to stimulate a struggling economy (as opposed to raising rates to cool down an economy that is overheating).
Most closely watched is the relationship between two-year and ten-year US treasury debt. The so-called spread between these two metrics can be seen in the chart below, with the grey areas indicating recessions that have tended to follow shortly after.
Spread between two-year and ten-year treasuries
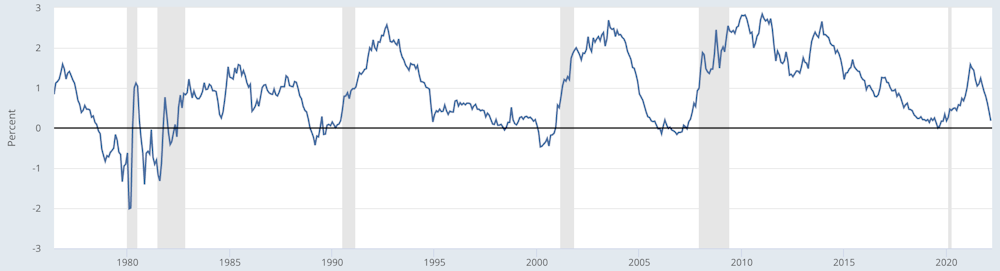
 St Louis Fed[2]
Quantitative easing
Another factor that is potentially affecting the yield curve is the Federal Reserve’s moves to buy government debt as part of its quantitative easing programme[3] (QE). The idea behind QE is that by buying long-term bonds, the Fed is able to keep long-term interest rates low, which decreases the rates on mortgages and other loans, thereby stimulating the economy. Conversely, when sold, lending rates will go up and economic activity will be reduced.
Earlier in March, the Fed started raising the benchmark US interest rate and stopped the asset purchases under the QE programme that it launched in 2020 in response to the COVID pandemic. But it also indicated that it would only start selling these assets after several months of hiking the benchmark rate. Since the benchmark rate is a short-term rate, the yield curve inverting might indicate market expectations that short-term interest rates will be higher than long-term ones for the foreseeable future.
Which yield curve should we consider?
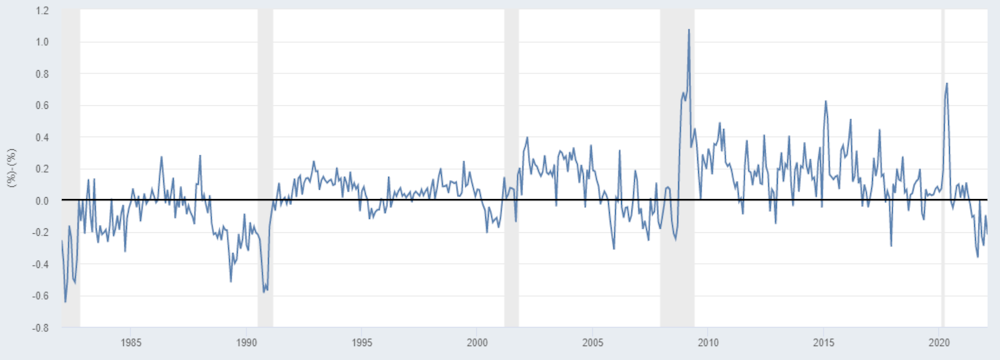
It is also sometimes argued that two-year/ten-year spreads are not the most useful ones to watch, and that instead one should focus[4] on yields at the shorter end of the yield curve. In this set up, if you look at the difference in yields between two-year and three-month treasuries, it is actually steepening[5]: in other words, it is hinting that economic growth is going to increase in the short term.
Economists sometimes argue that these near-term yield curve movements have stronger predictive power than those further out. At the very least, the fact that these are saying something different shows the need to be careful because different data about treasury yields can depict a different (or even opposite) picture depending on what time horizon you are considering.
Spread between two-year and three-month treasury yields
St Louis Fed[2]
Quantitative easing
Another factor that is potentially affecting the yield curve is the Federal Reserve’s moves to buy government debt as part of its quantitative easing programme[3] (QE). The idea behind QE is that by buying long-term bonds, the Fed is able to keep long-term interest rates low, which decreases the rates on mortgages and other loans, thereby stimulating the economy. Conversely, when sold, lending rates will go up and economic activity will be reduced.
Earlier in March, the Fed started raising the benchmark US interest rate and stopped the asset purchases under the QE programme that it launched in 2020 in response to the COVID pandemic. But it also indicated that it would only start selling these assets after several months of hiking the benchmark rate. Since the benchmark rate is a short-term rate, the yield curve inverting might indicate market expectations that short-term interest rates will be higher than long-term ones for the foreseeable future.
Which yield curve should we consider?
It is also sometimes argued that two-year/ten-year spreads are not the most useful ones to watch, and that instead one should focus[4] on yields at the shorter end of the yield curve. In this set up, if you look at the difference in yields between two-year and three-month treasuries, it is actually steepening[5]: in other words, it is hinting that economic growth is going to increase in the short term.
Economists sometimes argue that these near-term yield curve movements have stronger predictive power than those further out. At the very least, the fact that these are saying something different shows the need to be careful because different data about treasury yields can depict a different (or even opposite) picture depending on what time horizon you are considering.
Spread between two-year and three-month treasury yields
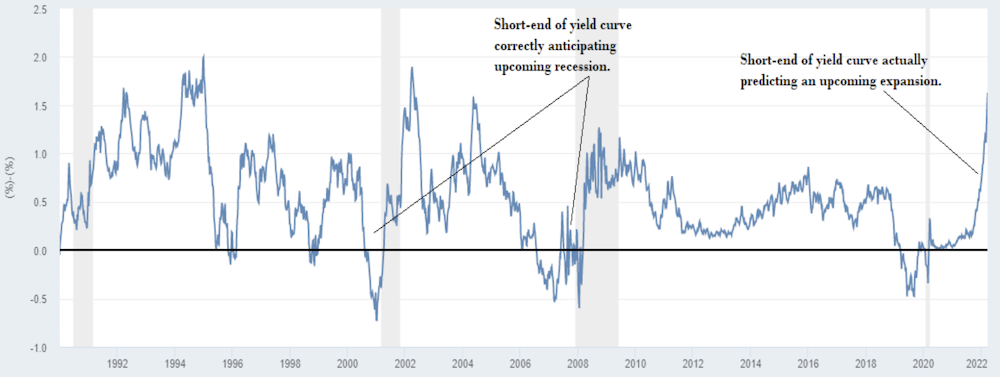 St Louis Fed[6]
To summarise, it doesn’t necessarily follow that an inverted yield curve will be followed by a recession. It certainly could mean that, in which case unemployment would likely rise and inflation would potentially come down more quickly than many are expecting. But for now, it’s too early to say. The debt market is certainly signalling that change is coming, though it’s often easier to say in hindsight what it meant than at the present time.
References^ St Louis Fed (fred.stlouisfed.org)^ St Louis Fed (fred.stlouisfed.org)^ quantitative easing programme (www.investopedia.com)^ one should focus (www.cnbc.com)^ actually steepening (www.cnbc.com)^ St Louis Fed (fred.stlouisfed.org)
St Louis Fed[6]
To summarise, it doesn’t necessarily follow that an inverted yield curve will be followed by a recession. It certainly could mean that, in which case unemployment would likely rise and inflation would potentially come down more quickly than many are expecting. But for now, it’s too early to say. The debt market is certainly signalling that change is coming, though it’s often easier to say in hindsight what it meant than at the present time.
References^ St Louis Fed (fred.stlouisfed.org)^ St Louis Fed (fred.stlouisfed.org)^ quantitative easing programme (www.investopedia.com)^ one should focus (www.cnbc.com)^ actually steepening (www.cnbc.com)^ St Louis Fed (fred.stlouisfed.org)