There will be more elections in 2024 than ever before – here's how it could affect financial markets
- Written by Gabriella Legrenzi, Senior Lecturer in Economics, Keele University

Rishi Sunak, the UK prime minister, has indicated that the upcoming UK election will not be until the second half of 2024, but this is just the tip of the iceberg for polling activity in the coming months. This is set to be the biggest election year[1] in history, with polls also in the US and more than 50 other countries around the world, including India and Mexico. In total, over 4 billion people will be casting votes.
How will all this affect the economy and the financial markets? Incumbent politicians[2] have an incentive to call an election when the economy is healthier, to enhance their chances of being re-elected. They often also manipulate taxes and spending to present a (short-lived) rosier picture to voters before polling day.
Yet timing an election is easier said than done. History shows that 18 out of the 31[3] elections held in the UK since 1900 have taken place during recessions, for instance (and 2024 could be[4] another example). There are also significant gaps[5] between the time any electoral “hand-outs” are implemented and their effects on the economy.
Elections and markets
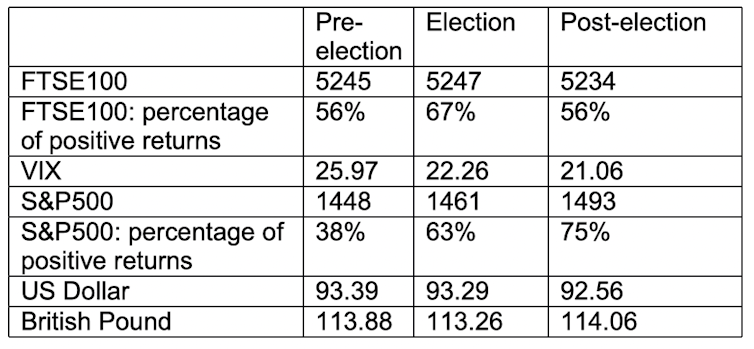
The effect of elections on financial markets is similarly capricious. On the one hand, it’s well known that investors dislike uncertainty[6]. This would point to lower stock market returns in the run-up to an election, then higher returns after the results are in. Yet the evidence doesn’t entirely support this. A study[7] from 2000, which looked at 33 countries including the US and UK, found evidence of higher returns before elections.
There’s also conflicting evidence about how markets are affected by election results. Some findings[8] show that left-wing victories tend to be associated with lower stock market returns, as investors anticipate higher inflation caused by increased spending and also higher taxes reducing consumption. Yet there’s also evidence[9] of higher stock market returns under Democratic victories in the US.
One explanation for these inconsistencies is that it can be difficult to discern a meaningful pattern when elections are relatively rare events. There’s similar inconsistency in the graph below, which plots the UK’s FTSE 100 index against its general elections (marked by the vertical brown lines). It also shows periods of Labour rule in white, and Conservative periods in grey (including the Con-Liberal coalition of 2010-15).
It’s hard to detect a meaningful and long-lasting effect either from the elections or changes in political leadership, particularly other events can often move markets more. For instance, the dramatic drop in the FTSE in 2020, a few months after the 2019 election, was linked not to Boris Johnson’s landslide victory but to the COVID pandemic.
FTSE 100, political leadership and UK elections


