I've been analysing the Bank of England's forecast over the past two years – here's how they got it wrong
- Written by Costas Milas, Professor of Finance, University of Liverpool

The Bank of England (BoE) has been strongly criticised[1] for failing to predict the surge in inflation. Had it done so, it could have reacted more quickly and prevented inflation from rising as high as 11%[2] in autumn 2022.
The bank acknowledges this failing and has asked[3] former Federal Reserve chairman Ben Bernanke to lead a review of its forecasting models for both inflation and GDP growth.
I’ve been doing my own analysis of the BoE’s record by comparing how it has performed relative to other forecasting models. This demonstrates the scale of the bank’s failing – and it turns out to have been compounded by a second error that may have made the situation worse.
Different forecasting models
The bank is not completely transparent about how it forecasts inflation, drawing on a number of in-house mathematical models[4]. It also factors in market expectations of interest rates and the bank’s judgement of where variables such as energy prices and the pound are heading. In my analysis, I refer to this as model 1[5].
As for the alternatives, model 2 is called a “quantile” model[6]. It incorporates three elements: a measure of whether the economy is overheating, known as the output gap[7]; the history of inflation; and the effect of quantitative easing (QE), in which central banks have tried to stimulate their economies by “creating” money.
Model 3, known as an econometric vector autoregressive (VAR)[8] model, seeks to fully capture international effects on the UK economy. It looks at the interactions between pressures in the global supply chain[9], the output gap, inflation and the Bank of England benchmark interest rate[10]. It also incorporates oil prices[11] and global geopolitical risk[12], which tends to be be ignored by forecasting models.
Meanwhile, model 4 is a lot simpler, looking purely at the history of inflation to predict where it’s heading (we call this an autoregressive (AR) model[13]).
I’ve calculated what each model would have predicted for inflation between 2008 and 2023. I’ve also calculated a median showing the combined predictions of the models, since this often improves[14] results. For the sake of simplicity, I’ve focused on short-term forecasts, meaning those that predict for the coming three months (in other words, one quarter ahead). Looking at the bank’s short-term forecasting is important since this relates closely to its medium-term forecasts.
How they compare
The table below ranks these predictions based on a statistical test called the root mean squared error[15]: the closer to a score of zero, the more accurate the model.
Inflation model accuracy
Over the entire 15-year period, the BoE forecasts actually top the table. The median is only marginally behind in second place, followed by model 2.
Yet when you focus on the past two years, the period that really matters because inflation has been so high, a different picture emerges. Now, first place goes to model 3, whereas the BoE predictions fall to third place.
You get further insights by viewing the predictions in graph form against the path of inflation:
UK inflation predictions 2021-23
This demonstrates the bank’s under-predicting of inflation in 2021 (red line vs black line) – particularly compared to the international VAR model, in yellow.
It also shows the bank substantially over-predicted peak inflation in the final quarter of 2022, expecting 13.1% when it came in at 10.8%. After making that prediction in August 2022, the bank raised the benchmark interest rate by 0.5 points when it had previously only been raising at 0.25 points. It then raised by 0.5 points in September and by 0.75 points in November.
Without this over-prediction, the bank may not have sanctioned such panic rises. This would have put less pressure on the public and potentially made it less likely[16] that the UK will tip into recession in the coming months.
The next graph plots the models’ inflation predictions since 2008. It shows the BoE considerably under-predicted inflation after initiating QE in 2009, raising questions about its understanding of the impact of the policy. Note that model 2, which attempts to take QE into account, did a much better job in that period, whereas it was one of several occasions when model 3 was less accurate.
UK inflation predictions 2008-23
Thoughts for the future
The latest inflation data[17], published on September 20, point to 6.8% inflation in the third quarter of 2023. I’ve included this in the first graph above, and you can see that the BoE’s forecasts from a few months ago predict this fairly well, as does model 3 (the other models are over-predicting).
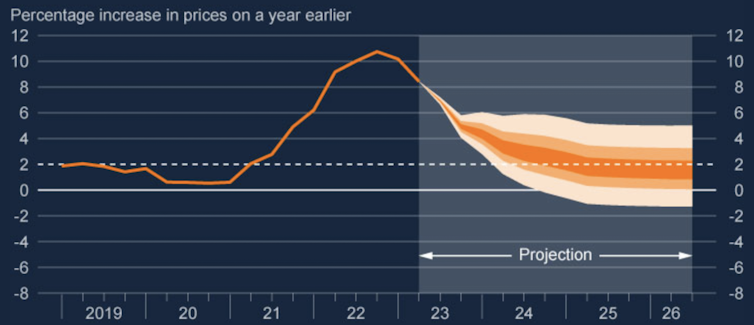
Be that as it may, the key point is that to predict inflation accurately, it is important to forecast from different models and to combine forecasts. Relying on a single forecast can often mislead and does no favours to the economics profession. The bank does publish a fan chart[18] that shows the probability that inflation will be above or below particular values, but this doesn’t always make things better: when it predicted 13.1% inflation for the final quarter of 2022, it attached a 50% probability to inflation being even higher.
Bank of England inflation fan chart


