
we've calculated the income tax revenue lost in their wake
- Written by: Merve Küçük, PhD Candidate, Deakin University
Understanding the true cost of natural disasters is critical for governments to develop policies to deal with them.
Historically, calculations have been based on toting up insurance claims and government aid[1]. But these don’t account for intangible social costs such as lower mental health and higher substance abuse in the years that follow. Nor do they account for lower economic output[2] in affected areas.
Our latest research calculates, for the first time, the effect of a natural disaster on income tax revenue.
For this we’ve used data from the 2010-2011 floods that ravaged Brisbane and other towns in south-east Queensland. Our analysis covers about a third of Queensland’s population.
Our results show income tax revenue from the population analysed declined by 5% in the 2010/11 financial year, due to both lower incomes and higher tax-deduction claims.
Even though we can’t extrapolate this result to all disasters – type, location and size matter – our findings clearly show natural disasters have widespread financial effects, and that more frequent and severe natural disasters have clear implications for government revenue.
Queensland’s floods in context
The Queensland floods occurred between December 2010 and January 2011. As with recent floods, they were driven by the La Niña weather pattern bringing heavy and persistent rain. This was topped off by severe storms when Cyclone Yasi made landfall in northern Queensland in February 2011[3].
Read more: One in 1,000 years? Old flood probabilities no longer hold water[4]
All but one of the state’s 73 local government areas[5] were declared disaster zones. An estimated 2.5 million of the state’s 3.4 million[6] population were affected[7], with 33 people killed.
The total cost calculated by Deloitte Access Economics[8] was A$14.1 billion (in 2015 dollars). This comprised A$6.7 billion in tangible costs (such as damage to private properties and infrastructure) and A$7.4 billion in intangibles (such as impacts on health and well-being).
Brisbane River catchment area
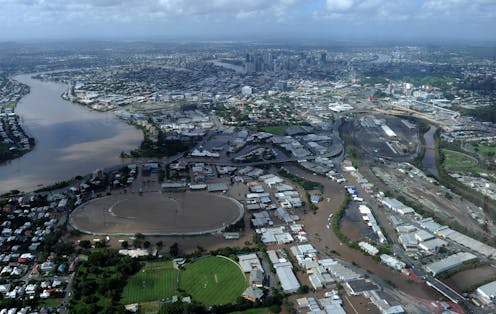
For our research we focused on the effects on the Brisbane River catchment area in south-east Queensland. This includes Brisbane, the city of Ipswich to Brisbane’s west and smaller townships.
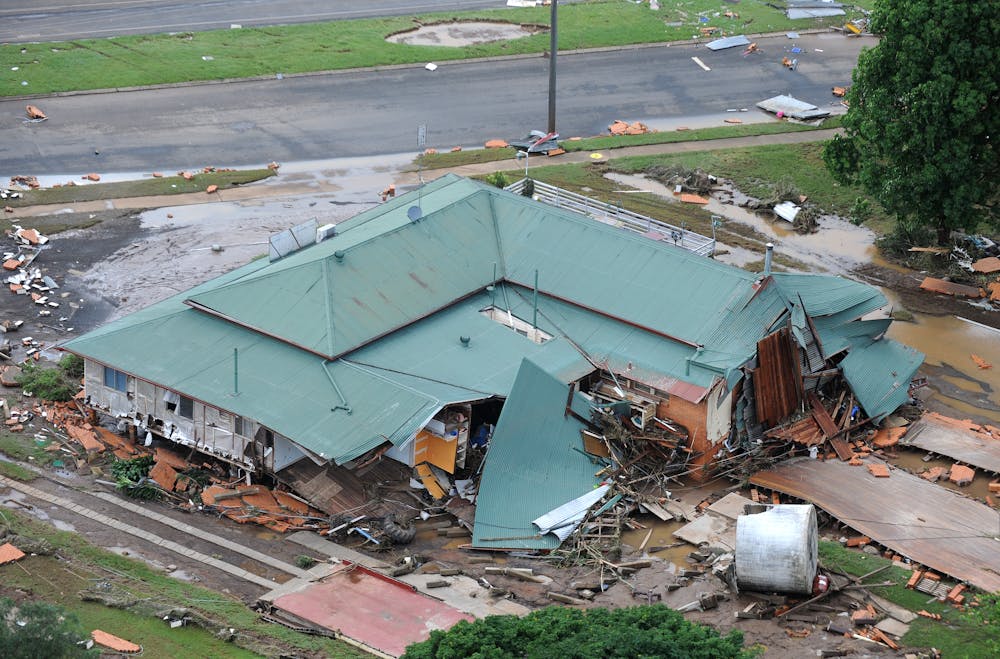
These were flooded in mid-January. Thousands had to evacuate and tens of thousands of homes and businesses were inundated to some degree.
The population of this catchment area in 2010 was about 1.4 million[9]. About 912,000 were taxpayers.
We examined data from the Australian Taxation Office’s Australian Longitudinal Individuals Files[10] (ALife) data set, which contains an anonymous 10% random sample of all Australian tax returns filed over the past three decades. Our sample set comprised 91,208 taxpayers.
Our method, called difference-in-differences, compared the changes in economic conditions of taxpayers living in the Brisbane River catchment area with taxpayers in demographically and economically similar zones in Sydney, Melbourne, Adelaide and Perth.
Lower income, less tax
We estimate the income tax revenue from the Brisbane River catchment area was reduced by about 5% in the disaster year. This amounted to about A$400 million less tax revenue. Total income tax revenue from the area in 2009/10 was A$7.7 billion.
The decline was due both to lower incomes and higher tax deductions.
We estimate average incomes were 2.4% lower in the 2010/11 financial year.
Those on lower incomes tended to suffer the bigger percentage losses. For the bottom third of income earners – on an average A$16,200 in the 2009/10 year – average incomes were 4.2% lower in 2010/11. Those in higher-income groups lost about 1.5%.
This is consistent with previous research[11] (using census data) showing low-income earners, part-time workers and small-business owners tend to lose the most income after disasters.
Read more: Natural disasters increase inequality. Recovery funding may make things worse[12]
Higher deductions, less tax
Along with income losses, the value of tax deduction claims in the Brisbane river catchment area increased by about 2% in 2010/11.
These covered such things as deductions on work-related travel, clothing and “other” expenses. They also included more tax-deductible gifts and donations, which is commonly observed after a disaster.
Higher income groups claimed more deductions, reducing tax payable.
Those in the top third of incomes – earning an average of AU$91,600 – paid 3% less tax. Those in the middle third – earning an average of AU$39,000 – paid 8.7% less. There was no discernable change in income tax paid for those in the lowest income group.
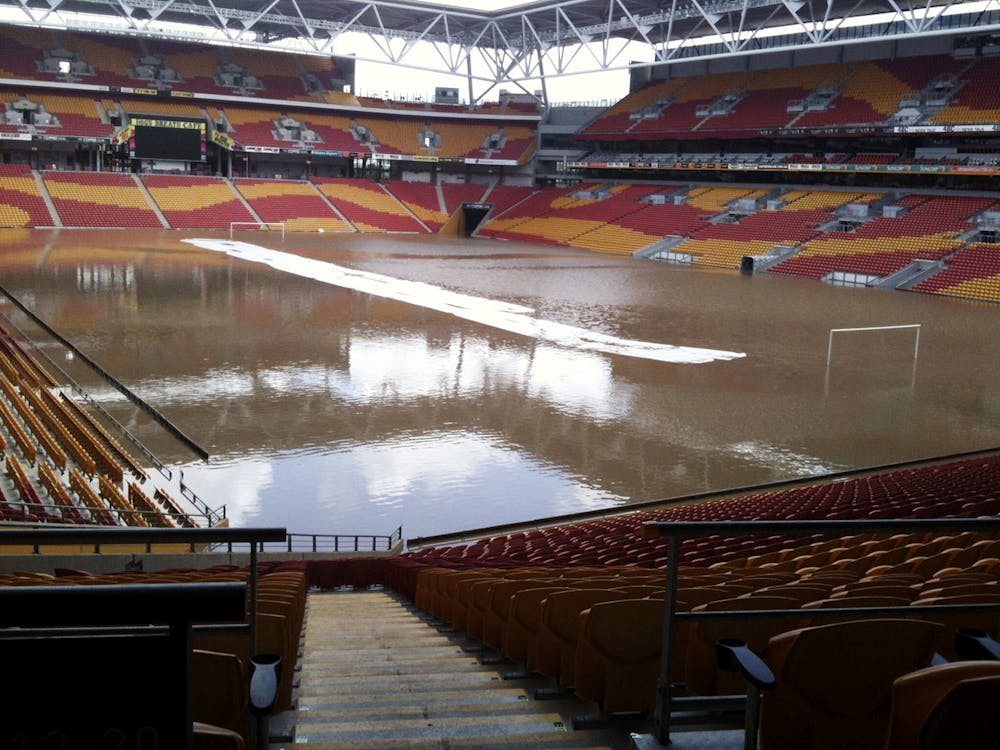 Brisbane’s Suncorp Stadium, flooded on Friday Jan 14 2011.
AP
Brisbane’s Suncorp Stadium, flooded on Friday Jan 14 2011.
AP
Financial impacts reach far beyond direct victims
Our findings add to the growing body of research showing natural disasters have significant socio-economic effects, with income losses compounding inequality.
Our research also underlines that everyone is to some extent affected financially, as every natural disaster reduces the tax revenue collected and increases demands on the the public purse.
Read more: It can't all be insured: counting the hidden economic impact of floods and bushfires[13]
Quantifying the full extent of disaster costs is crucial for governments to budget and build sustainable policies investing in disaster mitigation and recovery.
With scientists predicting more frequent and severe natural disasters, we need a full picture of their likely costs, who is going to pay, and how.
References
- ^ insurance claims and government aid (www.oecd.org)
- ^ lower economic output (theconversation.com)
- ^ in February 2011 (www.bom.gov.au)
- ^ One in 1,000 years? Old flood probabilities no longer hold water (theconversation.com)
- ^ 73 local government areas (www.qra.qld.gov.au)
- ^ 3.4 million (www.abs.gov.au)
- ^ were affected (www.qra.qld.gov.au)
- ^ Deloitte Access Economics (australianbusinessroundtable.com.au)
- ^ 1.4 million (population.com.au)
- ^ Australian Longitudinal Individuals Files (alife-research.app)
- ^ previous research (www.bnhcrc.com.au)
- ^ Natural disasters increase inequality. Recovery funding may make things worse (theconversation.com)
- ^ It can't all be insured: counting the hidden economic impact of floods and bushfires (theconversation.com)
Authors: Merve Küçük, PhD Candidate, Deakin University