
Sure, the national accounts show GDP going backwards, but look at what's to come
- Written by: Peter Martin, Visiting Fellow, Crawford School of Public Policy, Australian National University
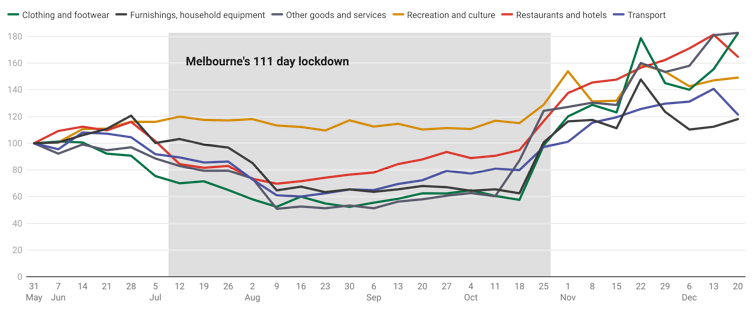
The most revealing graph presented in Wednesday’s September quarter national accounts[1] is one showing what has happened just beyond the end of the September quarter, in the one we are in now.
Melbourne’s lockdown ended on October 27.
The graph uses anonymised bank account data to show what happened to spending in Victoria as soon as the lockdown was lifted[2].
Selected Victorian spending data

Spending on clothing, furnishings, recreation, transport and restaurants and hotels surged.
As happened after last year’s lockdowns, Victorians returned to spending pretty much what they had before.
Read more: GDP is like a heart rate monitor: it tells us about life, but not our lives[4]
The September quarter national accounts released on Wednesday are a statement of their time – they show what things were like when NSW, Victoria and the ACT were locked down.
Australia’s gross domestic product shrank 1.9% in the three months to September, after climbing for four consecutive quarters following the record hit of 6.8% from the first wave of COVID and last year’s lockdowns.
Australian quarterly gross domestic product
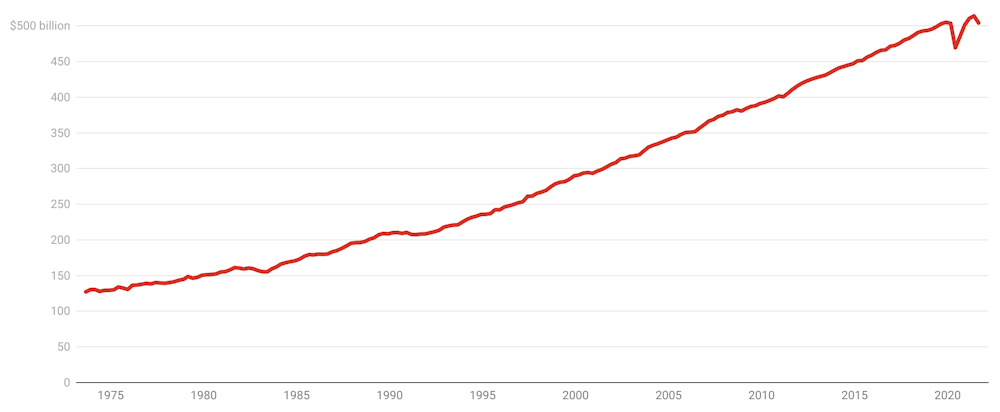 Chain volume measures, seasonally adjusted.
ABS[5]
Chain volume measures, seasonally adjusted.
ABS[5]
The biggest hit to GDP came from household spending, down 4.8% in the quarter.
National spending on hotels, cafes and restaurants fell 21.2%, spending on recreation and culture fell 11.8%, and spending on transport fell 40.8%.
Household final consumption expenditure
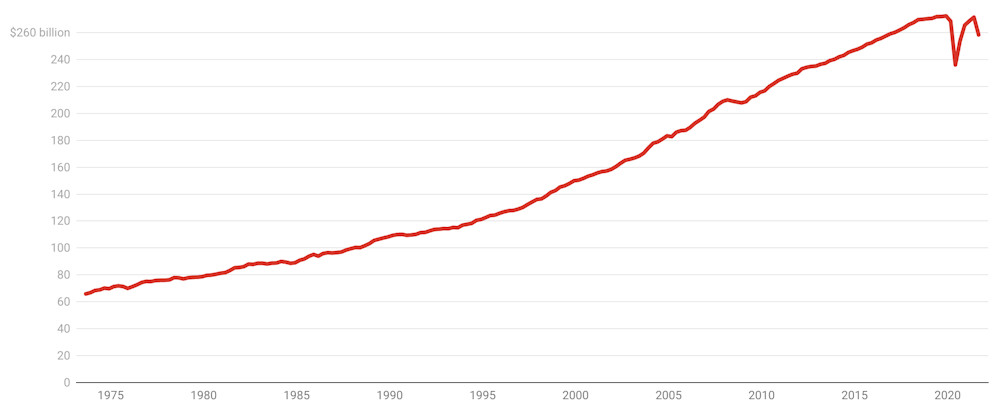 Chain volume measures, seasonally adjusted.
ABS[6]
Chain volume measures, seasonally adjusted.
ABS[6]
But the decline was anything but national.
Whereas spending in hotels, cafes and restaurants collapsed 33% (or more) in each of the states that were locked down, in the states that weren’t, it barely suffered.
Aggregate spending shrank 6.5% in NSW, 1.4% in Victoria and 1.6% in the ACT, while climbing strongly in the states that weren’t locked down, surging an impressive 4% in the Northern Territory and 4.2% Tasmania.
State final demand, September quarter
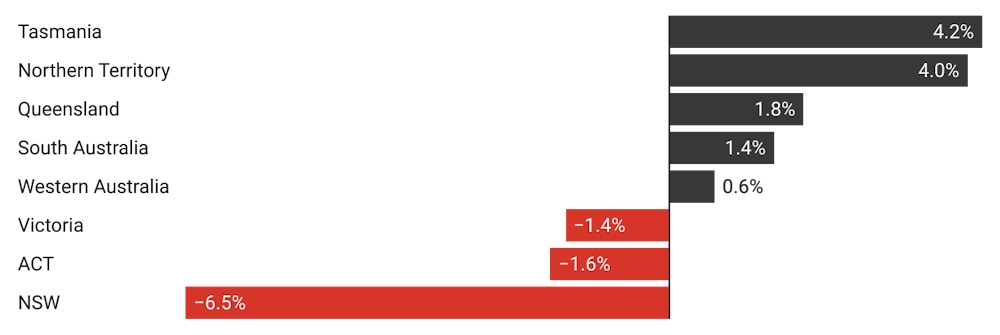 Seasonally adjusted.
ABS[7]
Seasonally adjusted.
ABS[7]
Nationally, personal saving soared, with the jump centred in the lockdown states as those households whose income hadn’t taken a hit saved more because of concern about the future and fewer opportunities to spend.
The national household saving rate bounded back up to an extraordinary 19.8% of household income from the 11.8% it fell to in March, after hitting an all-time high of 23.3% in the first wave of lockdowns.
Household saving ratio
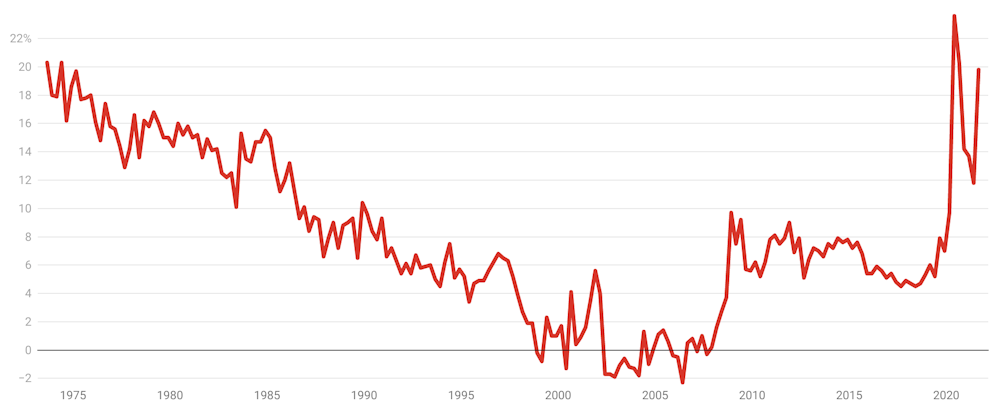 Ratio of saving to net-of-tax income, seasonally adjusted.
ABS[8]
Ratio of saving to net-of-tax income, seasonally adjusted.
ABS[8]
The bank-sourced data on post-lockdown spending in the lockdown states suggests household saving is already on the way down.
At his parliament house press conference, Treasurer Josh Frydenberg spoke of the unusually high saving rate as a source of future spending.
“Not all of it is going to be spent,” he said. “But it’s a lot of damn money that’s been accumulated”.
Read more: Four GDP graphs that show how well Australia was doing, before Delta[9]
If household spending had been the only thing driving changes in gross domestic product, it would have been down 2.5%. Working in the other direction this quarter was a jump in net exports and a jump in government spending. Neither business investment nor housing construction changed much.
Organisation for Economic Co-operation and Development forecasts released late Wednesday have the Australian economy growing 4.1% in 2022, up from 3.8% this year, slipping back to 3% in 2023.
The OECD Economic Outlook[10] has Australia’s unemployment rate falling to 4.7% in 2022 and 4.3% in 2023. It says as inroads are made into unemployment, wage and price pressures will build, but are expected to “remain contained”.
The organisation welcomes Australia’s commitment to net zero emissions by 2050, but says the strategy should be “comprehensive, effective and inclusive”. Its report backs a call for an independent review of the Reserve Bank.
It forecasts global growth of 4.5% and 3.2% in 2022 and 2023.
References
- ^ September quarter national accounts (www.abs.gov.au)
- ^ as the lockdown was lifted (www.abs.gov.au)
- ^ ABS (www.abs.gov.au)
- ^ GDP is like a heart rate monitor: it tells us about life, but not our lives (theconversation.com)
- ^ ABS (www.abs.gov.au)
- ^ ABS (www.abs.gov.au)
- ^ ABS (www.abs.gov.au)
- ^ ABS (www.abs.gov.au)
- ^ Four GDP graphs that show how well Australia was doing, before Delta (theconversation.com)
- ^ OECD Economic Outlook (www.oecd.org)
Authors: Peter Martin, Visiting Fellow, Crawford School of Public Policy, Australian National University