How Carolyn Creswell's Time Management Strategies Can Transform Your Workday
- Written by: Business Daily Media
Carolyn Creswell, the mastermind behind Carman's Fine Foods, has not only revolutionised the food industry but also become a beacon of inspiration for entrepreneurs everywhere. Her journey from being a determined student to leading a multi-million dollar company showcases the real power of effective time management. In today's fast-paced corporate world, mastering time management can be the key to heightened productivity and reduced stress. This article will unveil some of Creswell's most effective time management strategies, coupling them with actionable insights to transform your own workday.
Understanding Carolyn Creswell's Success Story
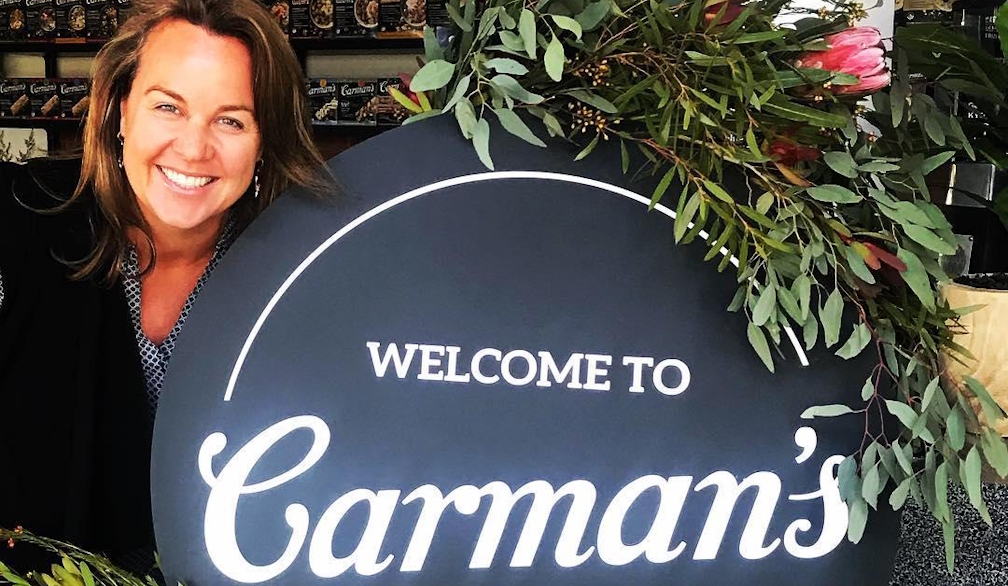
Carolyn Creswell's story is one of resilience and determination. She purchased Carman’s as a young university student for a mere $1,000, determined to turn a small muesli business into a nationally recognised brand. Over the years, her leadership paved the way for the brand to become synonymous with quality and innovation. Key to her success has been her exceptional time management skills. By strategically managing time at Carman’s, Creswell was able to focus on growth and innovation while maintaining the high standards the brand is known for.
Carolyn's journey demonstrates the transformative power of organising one's time efficiently. Her ability to prioritise, delegate, and embrace new technologies allowed her to navigate the business landscape successfully. For professionals and budding entrepreneurs, Carolyn's story underscores the importance of adopting effective time management strategies to achieve sustainable success and reach professional goals.
Prioritisation Techniques for Enhanced Productivity
At the heart of Carolyn Creswell's approach to effective time management is prioritisation. In her busy schedule, Creswell uses time-tested methods, such as the Eisenhower Box technique, to distinguish between what is urgent and what is important. The Eisenhower Box helps users categorise tasks into four quadrants: urgent and important, important but not urgent, urgent but not important, and neither urgent nor important.
Real-life application of such a technique means focusing on tasks that contribute to long-term objectives rather than constantly responding to immediate but less significant demands. This way of working ensures that time is spent on activities with the highest impact on a project's success.
For individuals aiming to implement these techniques in their workdays, starting with a clear goal-setting process can be pivotal. Once goals are set, breaking down tasks and using tools like the Eisenhower Box can sharpen focus, allowing for a more intentional allocation of time and resources towards achieving those goals.
The Art of Delegation: Freeing Up Time for High-Impact Tasks
Another cornerstone of Carolyn Creswell’s time management strategy is delegation. Knowing what to delegate not only cultivates a competent team but also frees up time to concentrate on tasks that truly require her unique expertise.
Creswell’s methodology involves clear identification of tasks suitable for delegation by considering their repetitive nature, the level of skill required, and strategic importance. This balance between control and trust is crucial; while some tasks require a personal touch, others can provide growth opportunities for team members.
For those looking to embrace delegation, start by auditing your workload to identify tasks that could be passed on. Establish clear guidelines and outcomes for delegated tasks while empowering team members with the autonomy needed to accomplish them. This approach not only optimises workflow but also fosters professional development within your team.
Embracing Technology for Smarter Workflows
In an era where technology can significantly boost efficiency, Carolyn Creswell has seamlessly integrated various tools and apps into her workflow. Technologies like task management apps, collaborative platforms, and automation tools are crucial in streamlining business operations.
To harness the power of technology in day-to-day activities, it’s essential to first identify the tools that best fit one's specific workflow needs. By reducing manual processes and repetitive tasks, technology can free up time for more critical, strategic activities.
Despite its myriad benefits, some may hesitate to adopt new technologies due to perceived complexity. Overcoming these barriers often requires a shift in mindset, comprehensive onboarding, and ongoing support to encourage consistent usage and integration. Examples of successful technology adoption can serve as motivating case studies, illustrating how tech adoption can bolster productivity and innovation.
Building a Flexible Yet Structured Work Schedule
Achieving a balance between flexibility and structure within one's daily schedule is another insight gleaned from Carolyn Creswell's work philosophy. While structure provides stability and predictability, flexibility permits adaptability in the face of new challenges or opportunities.
Creswell's approach involves setting a structured framework for her workday while allowing room for spontaneity when needed. This might mean scheduling time blocks for focused work, leaving gaps for unforeseen tasks, or moving tasks around as priorities shift.
In the long run, maintaining a flexible yet structured routine encourages resilience. Professionals can more easily adapt to market changes or unexpected events, all while ensuring consistent progress towards long-term objectives.
Conclusion
In summary, Carolyn Creswell’s success can be extensively attributed to her adept time management skills. Through effective prioritisation, skillful delegation, smart use of technology, and a balanced work schedule, she has not only managed Carman’s efficiently but has set a benchmark for aspiring entrepreneurs.
Adopting these strategies into everyday work life promises a transformation not only in productivity but also in professional satisfaction and career growth. Start today with small but intentional changes to your time management approach, and continue to learn and adapt. As the adage goes, time is the most valuable thing a person can spend, so spending it wisely will assuredly lead to success.