
how experts pick goods to track price changes and what it says about UK consumers
- Written by: Robert O'Neill, Teaching Focused Lecturer in Econometrics, University of Manchester
For the first time in several generations, inflation is a concern for people in the UK. The Consumer Price Index (CPI) rose by 9% in the year to April 2022, the highest[1] 12-month inflation rate since reliable records began. At the same time, GDP growth[2] has slowed to almost zero, sparking fears of the return of stagflation[3] – a period of rising prices without noticeable economic growth. The last time this situation vexed economists and politicians was in the 1970s.
This means people are paying more attention to the measures of inflation – or price indices – that tend to be relegated to background noise during more positive economic times. In recent months, getting to grips with these measures has become central to understanding the nature of the UK’s cost of living crisis[4].
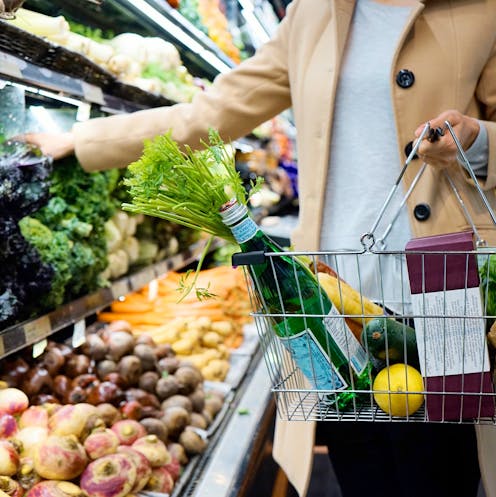
Filling the basket
So how are these inflationary measures created? Every year, a group of statisticians and market experts meet at the UK Office for National Statistics (ONS) to pick a “basket” of goods and services that will help them measure the increase in prices over time – also known as inflation. By tracking changes in the price of popular products such as pasta, power drills and package holidays, the government can monitor the impact on people’s ability to buy the things they need and want, providing a key measure of economic health.
The products and services that are picked for the basket, therefore, represent both consumer habits and overall pricing trends, and they change over time based on how households are spending their hard-earned cash.
There are no hard and fast rules about which items are selected as representative but, with millions to choose from, it makes sense to limit the size of the basket. Even so, this is usually set at around 700 goods and services. When total UK household expenditure on a certain product or service hits £400 million (based on the ONS Household Expenditure Survey[5]), it qualifies for representation in the basket. On the other hand, when expenditure drops below £100 million, an item is generally seen by the ONS as too niche to be in the basket. That’s why the basket has repeatedly contained flour and pyjamas, but not, for example, scuba diving gear, which not many people tend to buy.
Items in the basket are sorted into categories such as food, transport services and home appliances. These categories are weighted according to aggregate consumption (except at the lowest level of expenditure), based on the ONS Living Costs and Food Survey[6]. This ensures more commonly purchased items have more of an impact on the final figure for inflation.
Buying behaviour
The products included in the basket, as well as the weighting of each category, provide interesting insights into consumer behaviour, particularly when we look at changes to the basket over time. For example, while spending on leisure services[7] decreased to levels not seen since 1992 in the 2022 weighting, electricity[8] is on the rise. This reflects the fact that many UK households have been forced to spend less in certain areas to be able to afford necessities[9] as the cost of living continues to rise.
Unsurprisingly, the pandemic has also had a huge impact on the basket in recent years. In addition to antibacterial wipes, the 2022 basket refresh[10] ditched suits, a longtime staple of the working wardrobe. Instead, more casual clothing and even sports bras have been added to the basket, as people followed government advice[11] to remain active during lockdowns. The staying power of these new items versus suits could reveal a lot about the success of attempts by UK minister Jacob Rees-Mogg[12] and Tesla CEO Elon Musk[13] to bring workers back into the office.
Looking at differences in the contents of the basket[14] over longer stretches of time also shows how UK life has changed since the 1950s. Music lovers, for example, have witnessed various formats move into and out of the basket over the years as technology has developed – from vinyl and cassettes, to the brief reign of the compact disc from 1995 until 2006. Of course such physical products have been replaced by streaming service subscriptions in more recent baskets[15]. It’s also difficult to imagine anyone in 1947 understanding the addition of dating website fees[16] in 2011, or tablets the following year[17].
Such long-term insights are possible because the longest-running measure of price changes in the UK, the Retail Price Index (RPI[19]), was first introduced in 1947. It was the main UK inflation measure until it was challenged by the Consumer Prices Index (CPI[20]) in 1996. Since then, the CPI has gradually become the UK’s preferred measure of inflation, however in recent years a version that includes owner-occupiers’ housing costs (CPIH[21]) has also gained prominence. Confusingly, these indices are all used publicly and are all calculated in different ways. RPI calculations are generally higher[22] than the CPI results, partly because it includes housing costs in the form of mortgage interest payments.
Over the years, the differences between indices have led to “inflation shopping”. During industrial disputes, for example, employers might prefer to increase wages based on the CPI, while unions want to base negotiations on the higher RPI measure. To simplify the system, the government wants to scrap RPI[23] in 2030. The importance of housing to UK consumers means it will be replaced with the CPIH.
Making sense of inflation measures can be difficult, even for the most committed economists, and the minutiae of measurement can seem dry and uninspiring. But examining what we are buying can tell us a lot about how we live our lives on a daily basis. In 1967, the UK Ministry of Labour requested[24] the index cover meals eaten outside of the home, reflecting a rise in dining out across the UK. It now seems only a matter of time before inflationary baskets will include delivery fees for apps like Deliveroo and Just Eat.
References
- ^ highest (www.ons.gov.uk)
- ^ GDP growth (www.ons.gov.uk)
- ^ stagflation (www.worldbank.org)
- ^ cost of living crisis (www.jrf.org.uk)
- ^ ONS Household Expenditure Survey (www.ons.gov.uk)
- ^ Living Costs and Food Survey (www.ons.gov.uk)
- ^ leisure services (www.ons.gov.uk)
- ^ electricity (www.ons.gov.uk)
- ^ afford necessities (www.bbc.co.uk)
- ^ 2022 basket refresh (backup.ons.gov.uk)
- ^ government advice (www.gov.uk)
- ^ Jacob Rees-Mogg (www.telegraph.co.uk)
- ^ Elon Musk (www.bbc.co.uk)
- ^ contents of the basket (link.springer.com)
- ^ more recent baskets (www.ons.gov.uk)
- ^ dating website fees (www.ft.com)
- ^ following year (www.theguardian.com)
- ^ Yangchao/shutterstock (www.shutterstock.com)
- ^ RPI (www.ons.gov.uk)
- ^ CPI (www.gov.uk)
- ^ CPIH (www.ons.gov.uk)
- ^ generally higher (actuaries.blog.gov.uk)
- ^ scrap RPI (www.ft.com)
- ^ requested (link.springer.com)