I've fine-tuned a tool that advises the Bank of England what interest rates to set – here's what it says
- Written by Costas Milas, Professor of Finance, University of Liverpool

Interest rates were remarkably stable[1] in ancient societies. It has been argued that this was because they reflected the local system of numerical fractions. Classical Greece had a “normal” interest rate of 10% per annum to reflect its smallest fractional unit, dekate, for instance, whereas classical Rome’s was 8.33% per annum to reflect its smallest fractional unit of 1/12th, uncia.
This saved ancient policymakers from the trouble of making interest rate decisions based on the economic outlook. It also spared them from being dubbed “unreliable boyfriends[2]” by commentators for wrongfooting financial markets with their interest-rate decisions – unlike former Bank of England Governor Mark Carney and his successor, Andrew Bailey.
Bailey was most recently criticised in November when the Bank of England’s Monetary Policy Committee (MPC) voted to[3] keep the policy rate of interest on hold at 0.1% despite signalling that it would be raising it to ward off inflation. The MPC’s job is to use interest rates to keep consumer price index (CPI) inflation within its 2% target[4] over the next two years, but it is currently expected to remain above that until at least the first quarter of 2024[5].
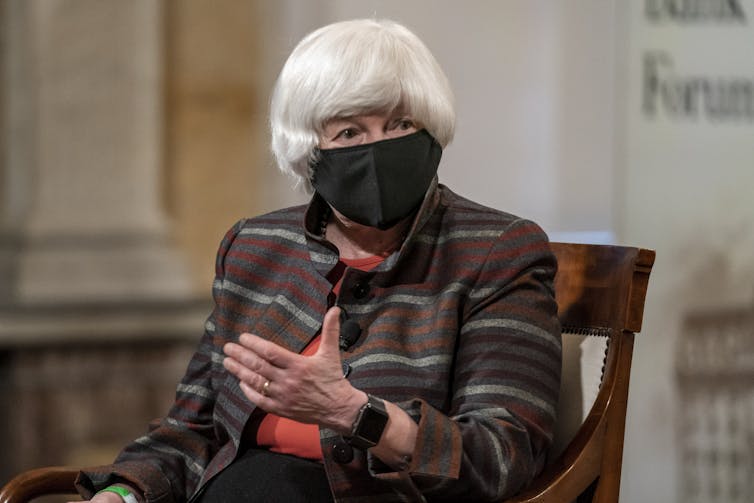
The bank’s policymakers decided against raising rates because a majority believe that the current inflationary pressures are, to some extent, temporary. But is that so? US Treasury Secretary Janet Yellen believes inflation will remain high until COVID is under control[6], since the surge in prices is closely linked to problems in the global supply chain which have meant that there is too little supply to meet demand.
In Yellen’s view this means stubbornly high inflation well into 2022, which raises the question of what temporary means – particularly now that the omicron COVID variant will potentially see supply-chain disruption going on even longer.
Yet the markets’ bigger concern about omicron is that it is going to hamper economic growth. Economic growth is another (more positive) cause of inflation, so the new variant will potentially reduce the price pressure. For that reason, market expectations[7] of imminent interest-rate rises have markedly weakened since omicron emerged. Paradoxically, however, delayed interest-rate action will arguably make it more likely that higher inflation (from prolonged supply-chain problems) will ultimately last longer.
To further raise the pressure on the MPC, the annual rate of inflation has just risen to 5.1%[8] (up from 4.2% a month ago). The bank’s deputy governor, Ben Broadbent, had predicted[9] recently that the UK wouldn’t hit this rate until the spring.
In this context, the MPC is currently meeting to make its latest decision on interest rates. So what should it do?
To help determine this, there is a model called the “monetary policy rule”, originally devised by economist John Taylor at Stanford in the 1990s[10], which takes several important variables into account. The first is the central bank’s two-year inflation forecast – in other words, the most likely outcome[11] based on market expectations of interest rates – relative to the official inflation target.
The second variable is UK economic growth relative to its long-run equilibrium level – that is, the Office for Budget Responsibility[12] (OBR) “output gap” measure of “excess demand” in the economy. According to the OBR, UK output is currently 0.7% above equilibrium.
To improve the accuracy of the monetary rule during the pandemic, I have incorporated a third variable[13], an “infectious disease equity market volatility tracker”. This is an index constructed and updated daily by a team of US economists[14]. It is based on approximately 3,000 US newspaper articles that contain economic terms such as “economy” and “financial”; stock market terms; volatility terms such as “uncertainty” and “risk”; and infectious disease terms such as “epidemic”, “pandemic”, “virus”, “flu” and “coronavirus”. The tracker is not just focused on COVID, and has over 20 years of historical data.
Infectious disease tracker, 1998-2021


