The 7 charts that show Australians struggling as saving falls to near zero
- Written by Stephen Bartos, Professor of Economics, University of Canberra

The national accounts released by the Australian Bureau of Statistics show economic growth slid to a measly 0.2%[1] in the last quarter.
That’s well down from a low 0.4% in the June quarter.
Of course, economic growth is not everything. The national accounts don’t measure, for example, unpaid work at home or caring work, volunteering work, or the state of Australia’s environment.
That said, other things being equal, it is better to have economic growth than a recession. Economic growth creates jobs and opportunities.
The miserably low rate of economic growth unveiled on Wednesday is cause for concern.
GDP per head is shrinking
Among the many reasons for the collapse, the most obvious is high interest rates.
Treasurer Jim Chalmers said the slump was an “inevitable consequence[2]” of higher interest rates and international uncertainty.
For individual Australians, it was even worse – growth per head went backward, in what some economists call a “per capita recession”.
GDP per capita fell 0.5% in the quarter to be down 0.3% over the year.
Disposable income per head fell for the second consecutive quarter.
In the September quarter it slid 1.4% after sliding 1.7% in the June quarter.
Disposable income is buying power adjusted for inflation, after tax. For households coming off fixed mortgages, the collapse is much greater.
The slide in ready income has forced households in aggregate to as good as stop saving in order to make ends meet.
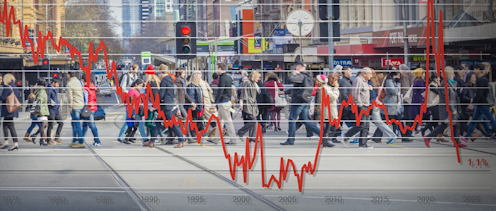
The household saving ratio has dropped from a peak of 20.4% of income during the COVID lockdowns to just 1.1% – the least in 16 years.
The ultra-low aggregate rate means that while some households are saving, many are using up what they had previously put away.
The real value of household spending grew not at all in the September quarter and climbed only 0.4% over a year in which Australia’s population grew by more than 2.4%.
The Bureau of Statistics said some of the restraint in recorded household spending was a statistical anomaly, caused by the treatment of government measures including electricity rebates and expansion of the childcare subsidies, which saw increased government spending on behalf of households.
The one bright spot identified by the bureau was “large-scale events including the 2023 FIFA Women’s World Cup” (go Matildas!). This helped push up spending on hotels, cafes and restaurants 0.9% and transport 3.9%.
Productivity turning back up
One positive from the depressing national accounts is that they will cause the Reserve Bank to think harder about whether further interest rate rises are needed.
Chalmers said the figures showed consumption was flat before[3] the bank’s November rate rise, and it was open to the bank to explain “what if anything today’s outcome means for their own forecasts”.
Another bright spot is productivity. After falling for five consecutive quarters, GDP per hour worked climbed 0.9% in the September quarter, allowing the bank to feel more relaxed about wage rises above its inflation target.
The drivers of productivity are complex, with skills and training, management quality, investment, competition and innovation all part of the picture. The Australian treasury published a good overview[4] of what is involved late last year.
In bad news for incomes, Australia’s terms of trade fell 2.6%.
The terms of trade measure the price we get for exports compared to the price we pay for imports. They are down 9% from their peak last year.
Export prices fell by 1.4% in the quarter due to lower prices for coal and gas exports. Import prices climbed 1.2%.
The changed trading environment helped push Australia’s current account back into deficit after five years in which it has been mostly in surplus.
The current account records the value of the flow of goods, services and income between Australian residents and the rest of the world. In the September quarter we sent more money out of Australia than came in.
The current account is volatile. While we have grown used to surpluses, we cannot expect the odds to be ever in our favour[5].
A more dynamic economy would help. That would mean more creation (and destruction) of companies. More investment in skills and training would help this along.
Greater dynamism is a challenge for everyone – one we have to meet to improve our chances of better news in future national accounts.
References
- ^ 0.2% (www.abs.gov.au)
- ^ inevitable consequence (ministers.treasury.gov.au)
- ^ before (ministers.treasury.gov.au)
- ^ good overview (treasury.gov.au)
- ^ ever in our favour (thehungergames.fandom.com)
Authors: Stephen Bartos, Professor of Economics, University of Canberra


